AMKA Technologies

AMKA Engineering / Thermography Inspection

Electrical thermography in Malaysia

Find overheating before it becomes a shutdown.

AMKA surveys live electrical panels, switchboards and terminations under normal operating load. You receive thermal evidence, a severity rating and a written action for every anomaly, without shutting down the screening scope.

Free proposal & quotation · Based in the Klang Valley · Nationwide service
Asset lists and BQs can be attached to the request

Need insulation-discharge screening too? See the combined Electrical Health Assessment →

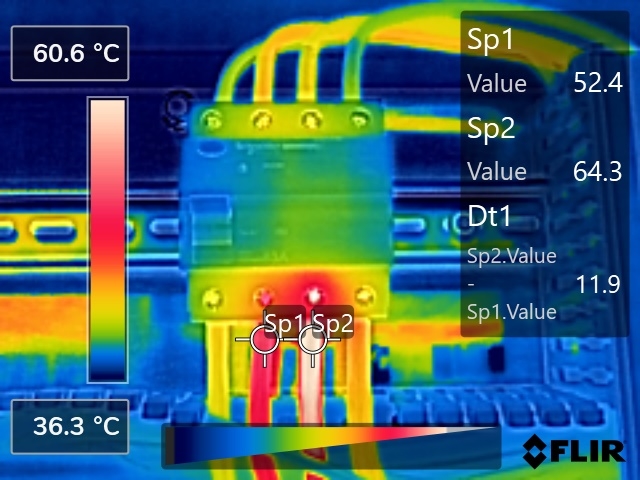
FLIR thermal image of a breaker connection measured at 64.3 degrees Celsius, 11.9 degrees above the comparison point Actual AMKA field evidence
Connection hotspot 64.3 °C

11.9 °C above the comparison point. Recorded while the equipment remained in service.

Surveyed live Finding rated Action in writing

01 / What the camera catches

Read the heat pattern against the operating context.

Anything failing by resistance shows as heat — and one failure mode shows as its absence.

AMKA / Decision guide

Read the pattern, then the context

01 / ThermographyHeat at connections
02 / InterpretationReference + load + severity
Illustration: Compare the thermal image with a reference and the operating load before assigning severity.
Loose connections

The slack joint

Increased connection resistance produces a local hotspot that can be found during a live survey.

Overload

The overworked circuit

An overloaded circuit can run hot. The thermal pattern must be read against its operating load.

Imbalance

The uneven phases

Uneven phase temperatures need checking against the measured current on each phase.

Failure reads cold, too

The dead element

A unit running cold among working neighbours is capacity already lost — found the same way.

02 / Real finds

Faults, as the camera found them.

Every one of these was on a live board that looked perfectly normal to the eye.

FLIR thermal image of a breaker's bottom terminals with one connection glowing at 64.3 degrees — 11.9 degrees above the neighbouring phase
FIG.01Sp2 at 64.3 °C — 11.9 °C over its neighbour

The loose connection

A slack joint cooking quietly — left alone, this is how panels burn.
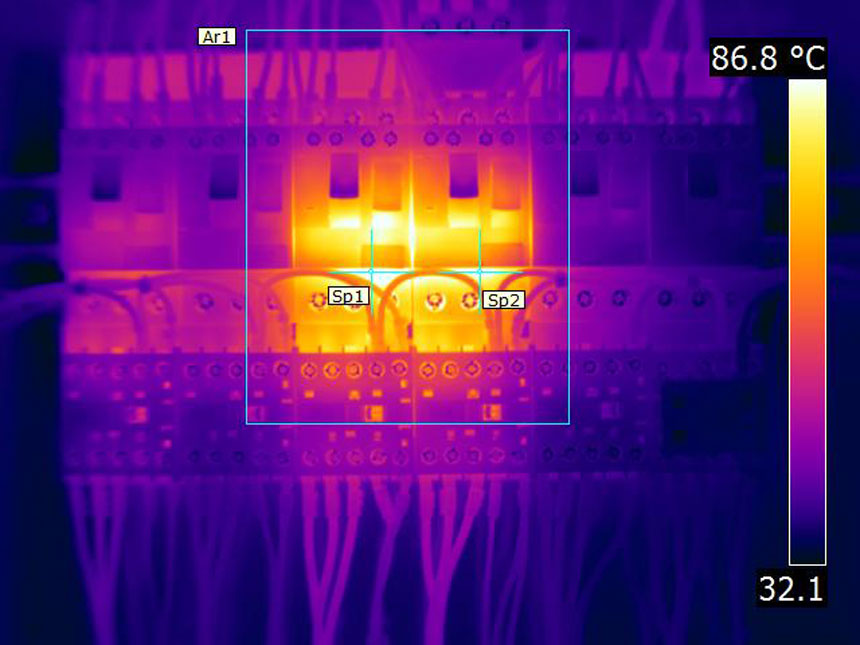
FLIR thermal image of a low-voltage board where two contactors glow at 86.8 degrees against a 32 degree background
FIG.02Peak 86.8 °C on a 32 °C board

The overload

Two contactors far above everything around them — heat long before the trip.
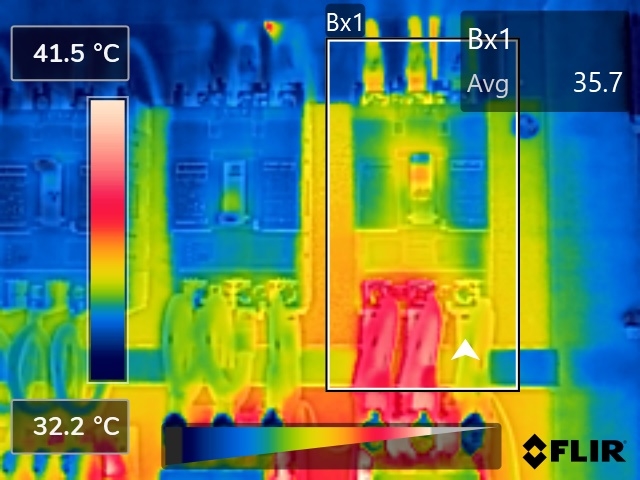
FLIR thermal image of a row of breakers where one unit's connections glow hot against its neighbours
FIG.03One breaker against its neighbours

The failing breaker

Identical breakers side by side, one running hot — the comparison is a finding to interpret in context.
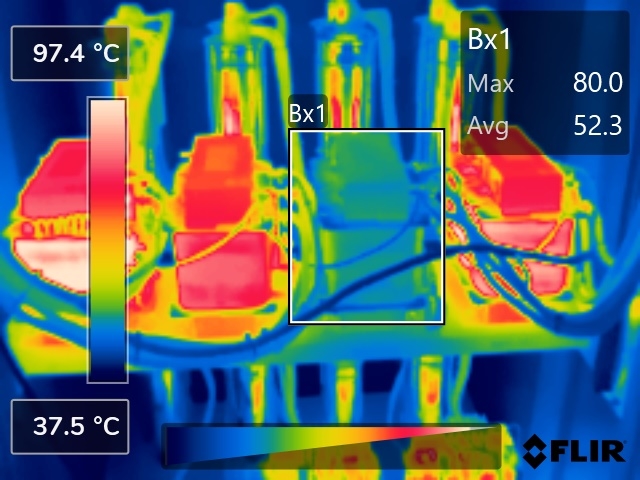
FLIR thermal image of a bank of units where the boxed one runs visibly cooler than its glowing neighbours
FIG.04One cold among the hot

The cold one

Failure reads in both directions — dead capacity hides until the day you need it.

03 / What the survey can show

Rated findings — and the limits, stated.

Does the plant have to stop?
The opposite — the survey needs the equipment running under real load, because a de-energised joint makes no heat. Nothing is opened beyond agreed covers, and nothing is shut down.
What does a rating mean?
Each anomaly is classified by its temperature rise against a reference — from monitor-and-recheck through to immediate corrective action. The classification logic is stated in the report, not left as our private opinion.
What can the camera not see?
Insulation discharge inside MV switchgear — it produces sound and voltage transients, not useful heat. That is a different instrument: the PD screen.
What does it cost?
Per asset, shaped by panel count, access and report depth — the full cost anatomy is published in what thermography actually costs in Malaysia, so you can sanity-check any quote, including ours.
How often should it be done?
Yearly as the default, six-monthly for equipment in poor condition or carrying open findings — the condition-based logic, and where it comes from, is set out in how often thermography should be done.